Table of Contents
1. Introduction
- Overall objective and montivation
Nowadays, accuracy is tremendously important in every industry.
We always trying to reduce error by changing materials, controlling movements.
In movement control, PID is one of the most common algorithm in industrial control.
PID is simple but effective. We achieve the goal by changing 3 gains.
Proportional gain, Integral gain, Derivative gain.
In my report, final goal is reducing vibration of the pendulum and reaching a stable state quickly.
I mainly use LEGO NXT, LEGO parts, Labview and Matlab.
By reducing vibration, we can reduce load on structure and get higher accuracy.
2. Theory
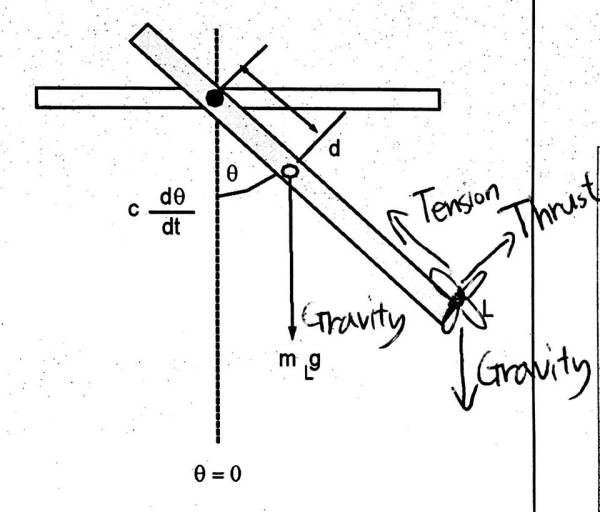
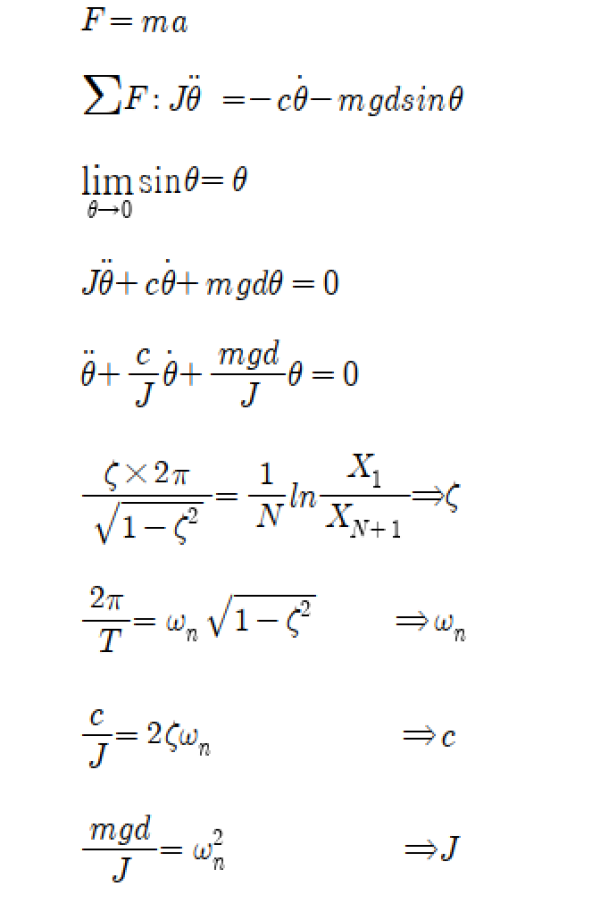
- Compound pendulum equation of motion
- Pole locations
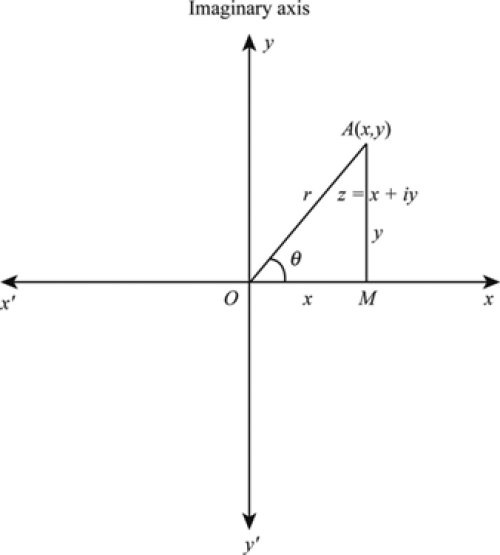
If point is left side of Imaginary axis, convergence
If point is right side of Imaginary axis, divergence
Distance between point to center means speed to convergence or divergence.
If point is far from the center, faster to convergence or divergence.
In boundary [-pi,+pi] angle that made between x axis and the line connected to point
called Arg z
This angle is for make only one Polar Coordinate system.
-PID control
PID control is kind of automatic control system especially feedback system.
We put some gains in closed loop system, and this gain will help to find out optimal value automatically.
P means proportional gain: Control proportional to error value
I means integral gain: Removing steady-state error
D means derivative gain: Block the fast change of output. Reduce overshoot, higher stability.
Each gains are related to error value, integral of error, derivative of error.
3. Simulink Simulations
-Pole placement control
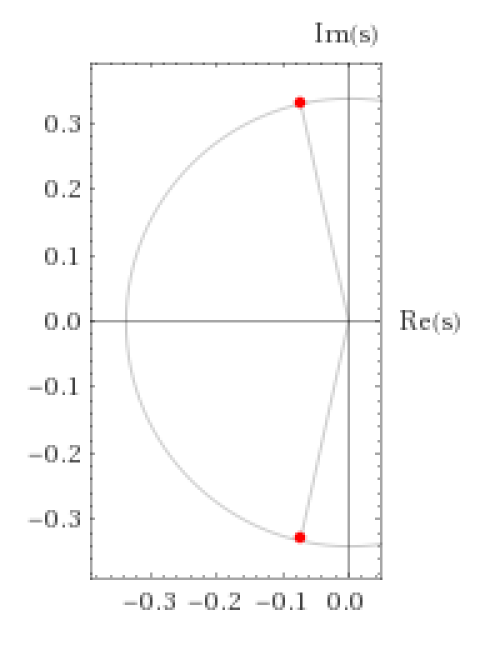
system=2.934/(s^2+0.1458*s+0.1146)
s=-0.0729-0.33058i,-0.0729+0.33058i
Left side of Imaginary Axis ⇒ Convergence
Arg z=102.44°
-PID control
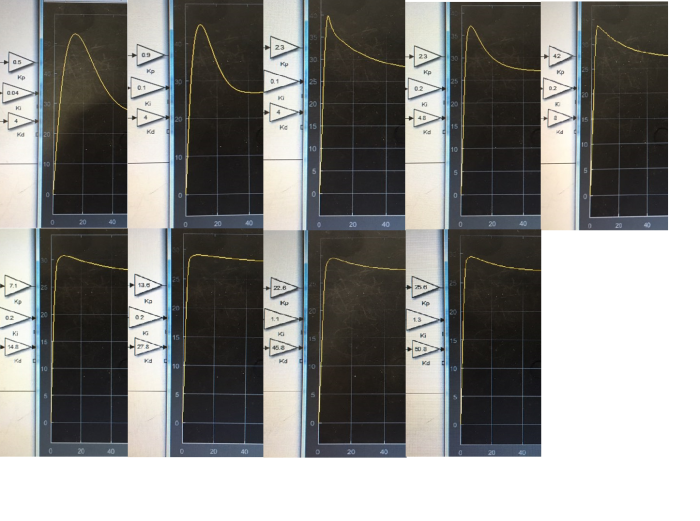
1T=25ms
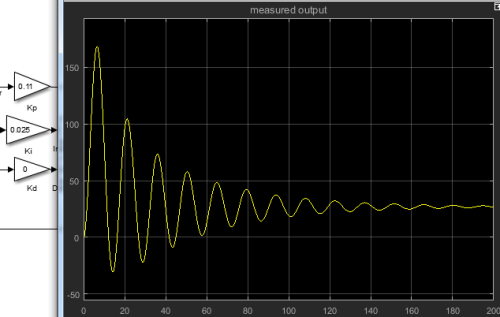
Case1: Overshoot with significant settling time
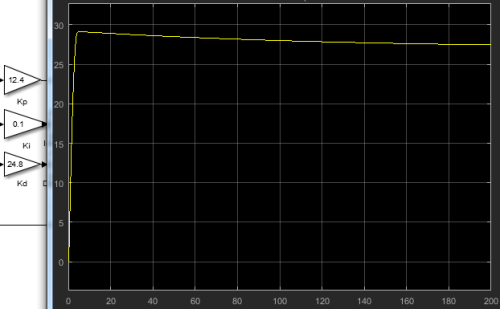
Case2: No overshoot but mediocre settling time
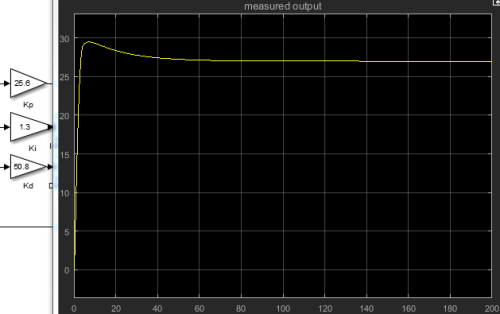
Case3: Slight overshoot
4. Experiments
-Description of experimental setup
-Photo of setup with annotated text or a drawing
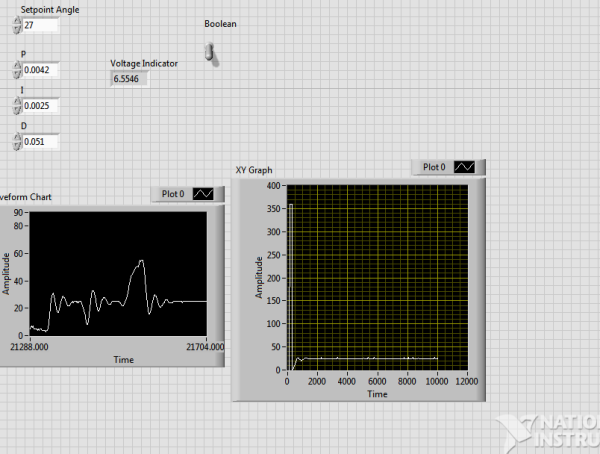
-LabVIEW screen shots of front panel and block diagram. Describe how the program works i.e. the role of each control in the block diagram
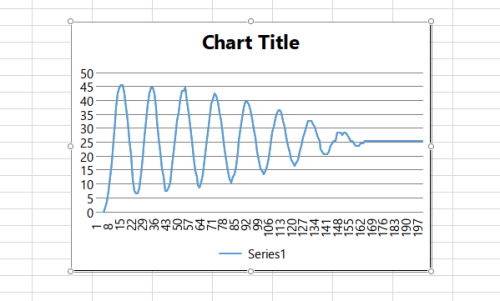
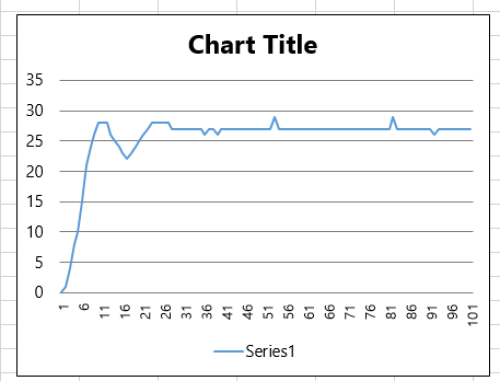
-Provide Excel plots of acquired data from PID control
\\\\\\\\\\\\\\\\\\\\\\\\\\\\\\\\\Before PID\\\\\\\\\\\\\\\\\\\\\\\\\\\\\\\\\\\\\\\\\\\\\\\\\\\\After PID\\\\\\\\\\\\\\\\\\\\\\\\\\\\\\\\
Case1: Overshoot with significant settling time(e.g. more than 10 seconds)
Case2: No overshoot but mediocre settling time(e.g. more than 5 seconds)
Case3: Slight overshoot(i.e. fast transient response) and fast settling time (e.g. less than 5 seconds)

